There are two different ways in which reports can be presented in WolkAbout IoT Web application:
- Dashboard chart widget - enables you to see live reading(s) in form of a chart (see Dashboard section for more information)
- Reports module - displays history of reading(s) along with other details and is located in the main menu under Reports page
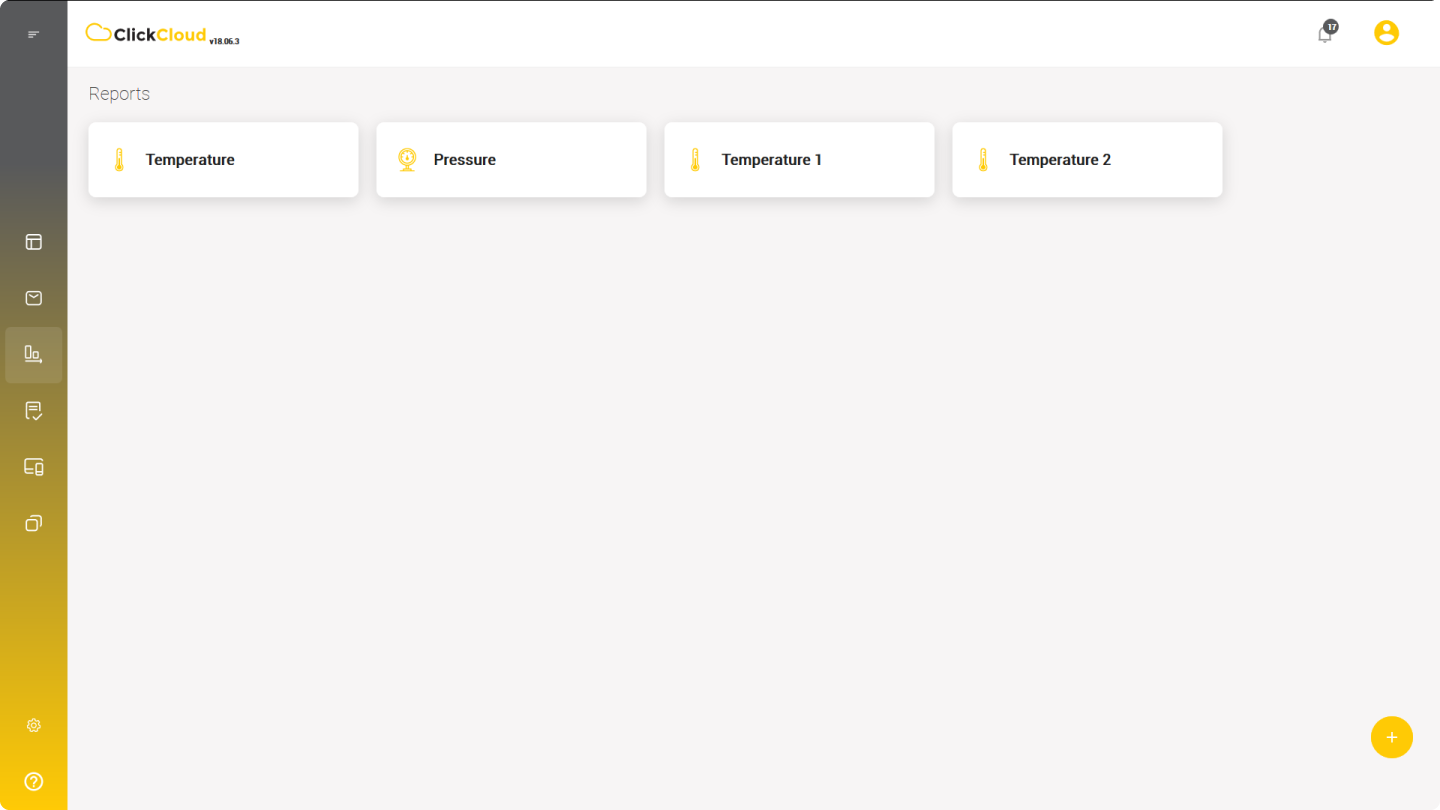
Reports main page displays all the reports created. They are displayed in form of tabs and can be edited or deleted.
Create Reports
Note: Prior to the next step, make sure you have connected at least one device/feed to the Platform!
To create a report:
- Go to Reports page
- Click + button
- Pop-up dialog Create new report will open with a list of tabs representing different types of feeds (e.g. temperature, pressure, humidity, movement…) you have available on the Platform
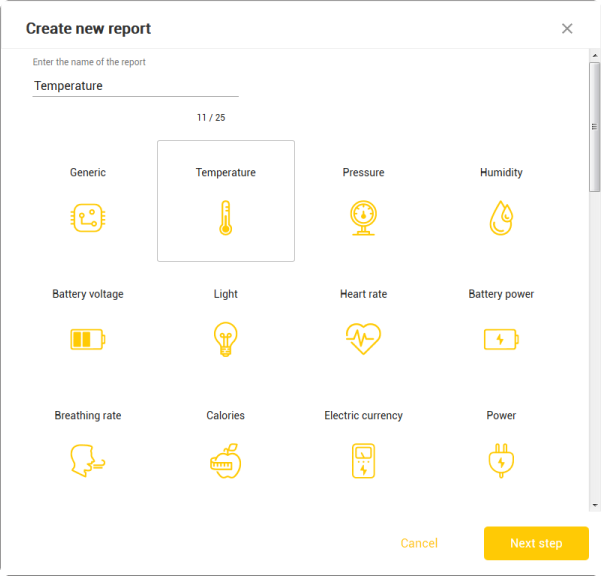
- Click on the tab depending on the type of feed you would like to be displayed
- You will get the list of all the devices containing the type of feed in question
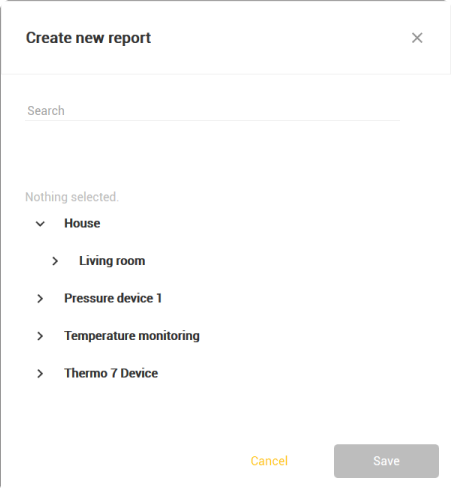
- Choose up to three feeds from multiple number of devices (only one feed per device), but they need to belong to the same reading type (e.g. device 1: temperature 1; device 2: temperature 2…)
- Click Save
- A dialog will pop up with the details of a report displayed on the screen and the readings of particular feed(s) represented in form of a chart
Report Details Screen
If you hover the cursor over the chart, it will display the exact reading of a feed at a particular time.
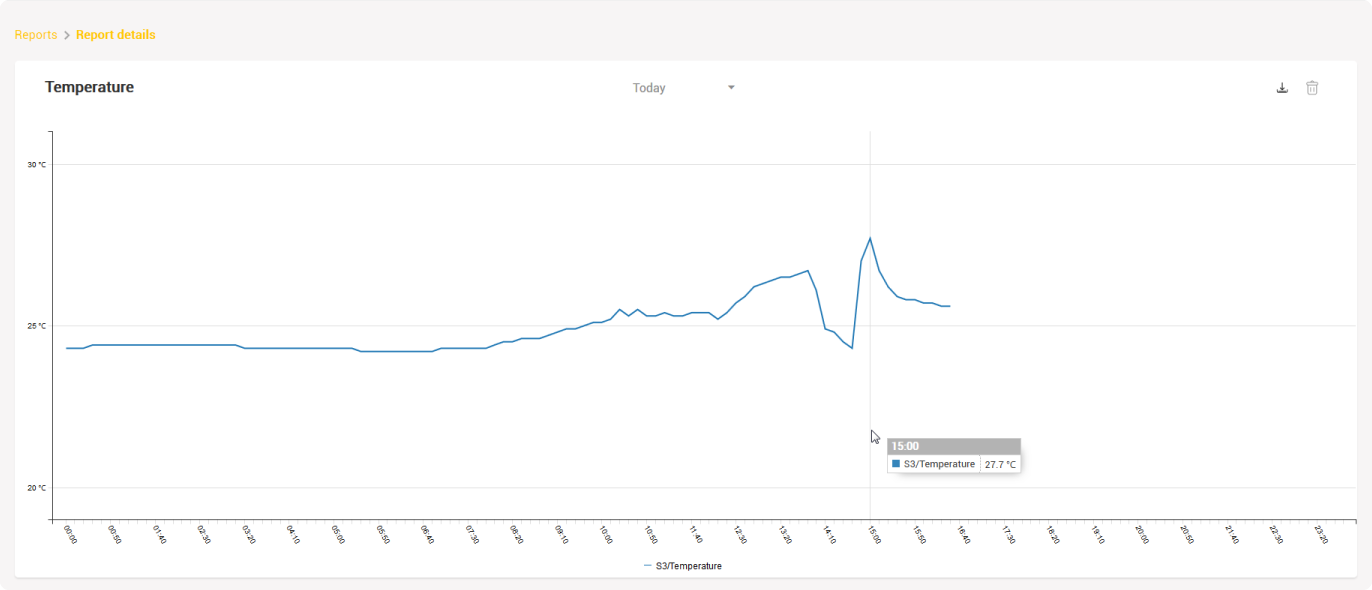
You can set up a chart to display readings for today, yesterday, this week, last week and this month.
There is also Pick a date option which allows you to select a start and end date of the reading(s) you would like to be displayed.
If you would like to export and store this data in CSV file, you can do that by clicking on Download button.
Edit Reports
To edit reports:
- Click the Settings button (appears when you hover your cursor over the report tab displayed on the screen)
- Create new report dialog will pop up with a name field and a drop-down list of all the devices that contain the type of feed in question
- Edit name and/or feed(s) displayed on a report card (e.g. temperature on the first floor to temperature on the second floor)
- Click Save
Remember that report can display only one type of feed (e.g. only temperature), therefore you cannot change the type of data displayed on a card (e.g. temperature to pressure) only the device(s) that send the data (e.g. temperature in living room to temperature in bedroom).
Delete Reports
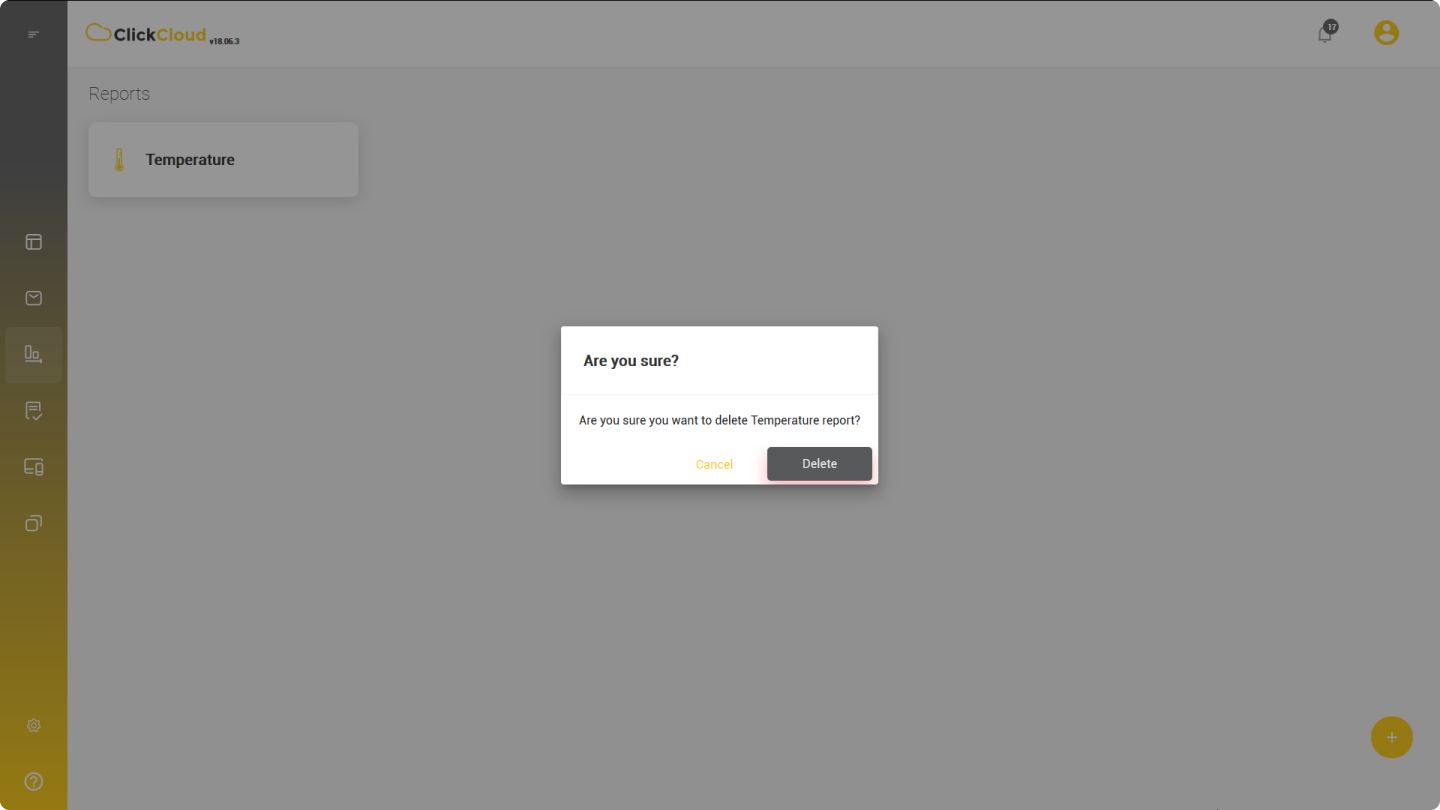
To delete a report:
- Click the x button that appears when you hover your cursor over the card
- New dialog will pop up asking you to confirm the action
- Click Confirm button to do so